S R T B H P N

UML Diagrams

Package, Class, and Activity diagrams


UML Diagrams

Universal Modeling Diagrams (UML) are diagrams that provide very useful abstractions for object-oriented code. There are many diagram types. The most often used are discussed here.
Package Diagrams:
A package is, for C++, a pair of files - header and implementation. The header file (*.h) contains prologue comments that describe the responsibilities of the package, declarations and inline definitions. The implementation file (*.cpp) contains all definitions not contained in the header. It also contains a test stub that is enclosed by a preprocessor definition that allows it to be included for stand-alone testing, and excluded for use with other code. A package diagram shows each of the packages in a design, using a package symbol, and shows their dependency relationships. In Figure 1. we show the package diagram for TextFinder, one of the tools from our code repositories. The package reponsibilities are:
  • TextFinder is responsible for finding every file, in a specified directory tree, that contains text matching a specified regular expression. It does that using services of the other packages shown
  • CodeUtilities provides processing of the program's command line, capturing each of the options specified there, and encapsulating them for use later in the program.
  • DirExplorerT is a reusable directory navigator that does a recursive depth first search of a specified directory tree. For each directory and file encountered, it calls doDir and doFile methods in a class that manages application specific details.
  • FileSystem is used by DirExplorerT to discover directories and files using the Windows API.
  • Application is an application specific class that defines processing for directories and files.
  • TextSearch defines how text files are opened and searched for regular expression matches.
Notice that the package diagram, augmented with package responsibilities, gives a quite clear top-level appreciation for the operations of this facility.
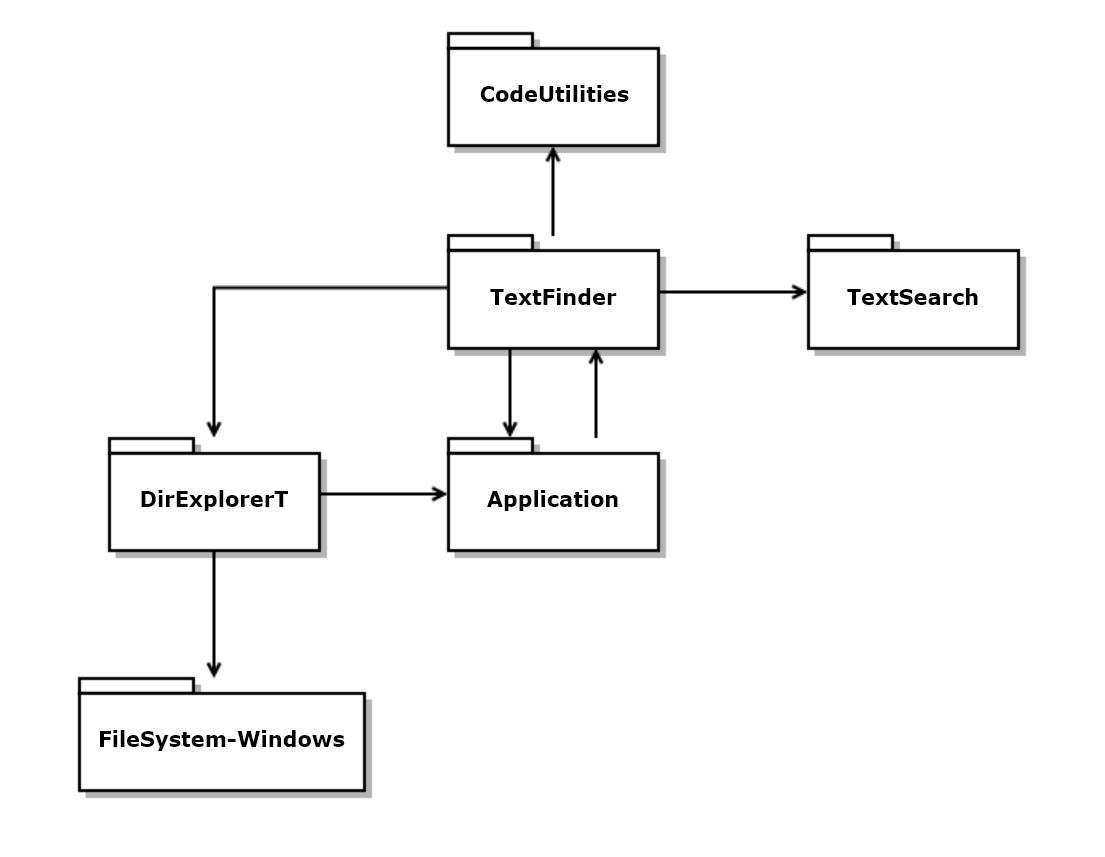
Figure 1. TextFinder Package Diagram
Show each package in a design, using a package symbol, and their dependency relationships.
Class Diagrams:
A class declares, and provides the facilities to construct, manipulate, and destroy encapsulated state, e.g., fundamental language types, library entities like vectors and deques, and user-defined types, i.e., instances of other classes. A class diagram shows each of the classes in one or more packages, using one of two class symbols - see Fig 2, and shows their relationships. Classes have four kinds of relationships with other classes: inheritance, composition, aggregation, and using. Inheritance is shown with a triangle symbol pointing to a base class and line extending to one or more derived classes. It represents an "is-a" relationship, as in a student is-a person. Composition is shown with a solid diamond that is adjacent to the composer with a line reaching to the composed class. Composition is a strong ownership relationship. The composer and composed have the same life-time. The composed is an integral part of the composer. Aggregation is shown with a hollow diamond that is adjacent to the aggregator with a line extending to the aggregated class. Aggregation is a weaker ownership relationship. An aggregated part may or may not exist throughout the lifetime of the aggregator. It is created and disposed by the aggregating class. Aggregation may occur when a method of the aggregator creates the aggregated instance on the native heap. It may also occur when the aggregator creates a local instance of the aggregated in one of its methods. Using is a non-owning relationship, shown by an arrow directed from the user to the used. Instances of used classes are passed to the user as a reference argument in one of its methods. These diagrams present an abstract representation of a design, in that they disclose no code, but they do present its logical structure. In Figure 2. we show the classes for TextFinder. TextFinder inherits the interface ITextFinder, composes an instance of DirExplorerT<Application>, and aggregates an instance of TextSearch. It does that by creating the instance as a local data member of its searchFile method. Application uses TextFinder through its interface ITextFinder. Finally, DirExplorerT<Application> composes an instance of ProcessCmdLine. We haven't shown the FileSystem classes as they are implementation details of the DirExplorerT<Application> class. We see that the Application class is used as a template parameter for DirExplorerT<Application>. Its methods doDir and doFile provide application specific processing so that DirExplorerT<Application> can be used without modification. We've seen that Application uses the interface ITextFinder (to access it's searchFile method). Because ITextFinder is an interface, Application can use TextFinder without incurring a build dependency. TextFinder uses the Application class definition to instantiate an instance of DirExplorerT<Application>.
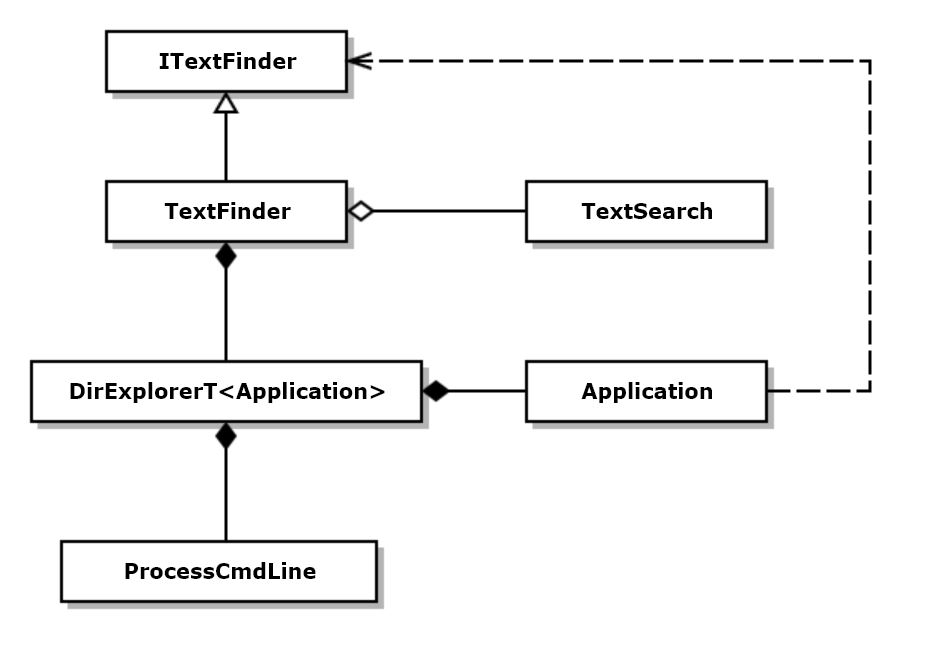
Figure 2. TextFinder Class Diagram
Show classes and their relationships: inheritance, composition, aggregation, and using.
Activity Diagrams:
Processing activities are shown as process "bubbles" connected with directed lines that describe processing flow. Every processing activity has at least one entering flow and at least one exit flow. There is always one initial flow indicated with a filled circle at the beginning end. There are always one or more exit flows that terminate on a hollow circle that contains a filled circle. I've shown bidirectional flows to represent flow from one process to another and then back. It is conventional to use two one-way flows in these diagrams. The bidirectional flows were used because the tool I used to generate them doesn't provide enough anchor points on the process bubbles. "Swim-lanes" are optionally used to show how processing is packaged in a design. That was done in Figure 3. for TextFinder. That helps us understand the sequence of calls made between packages and when they occur.
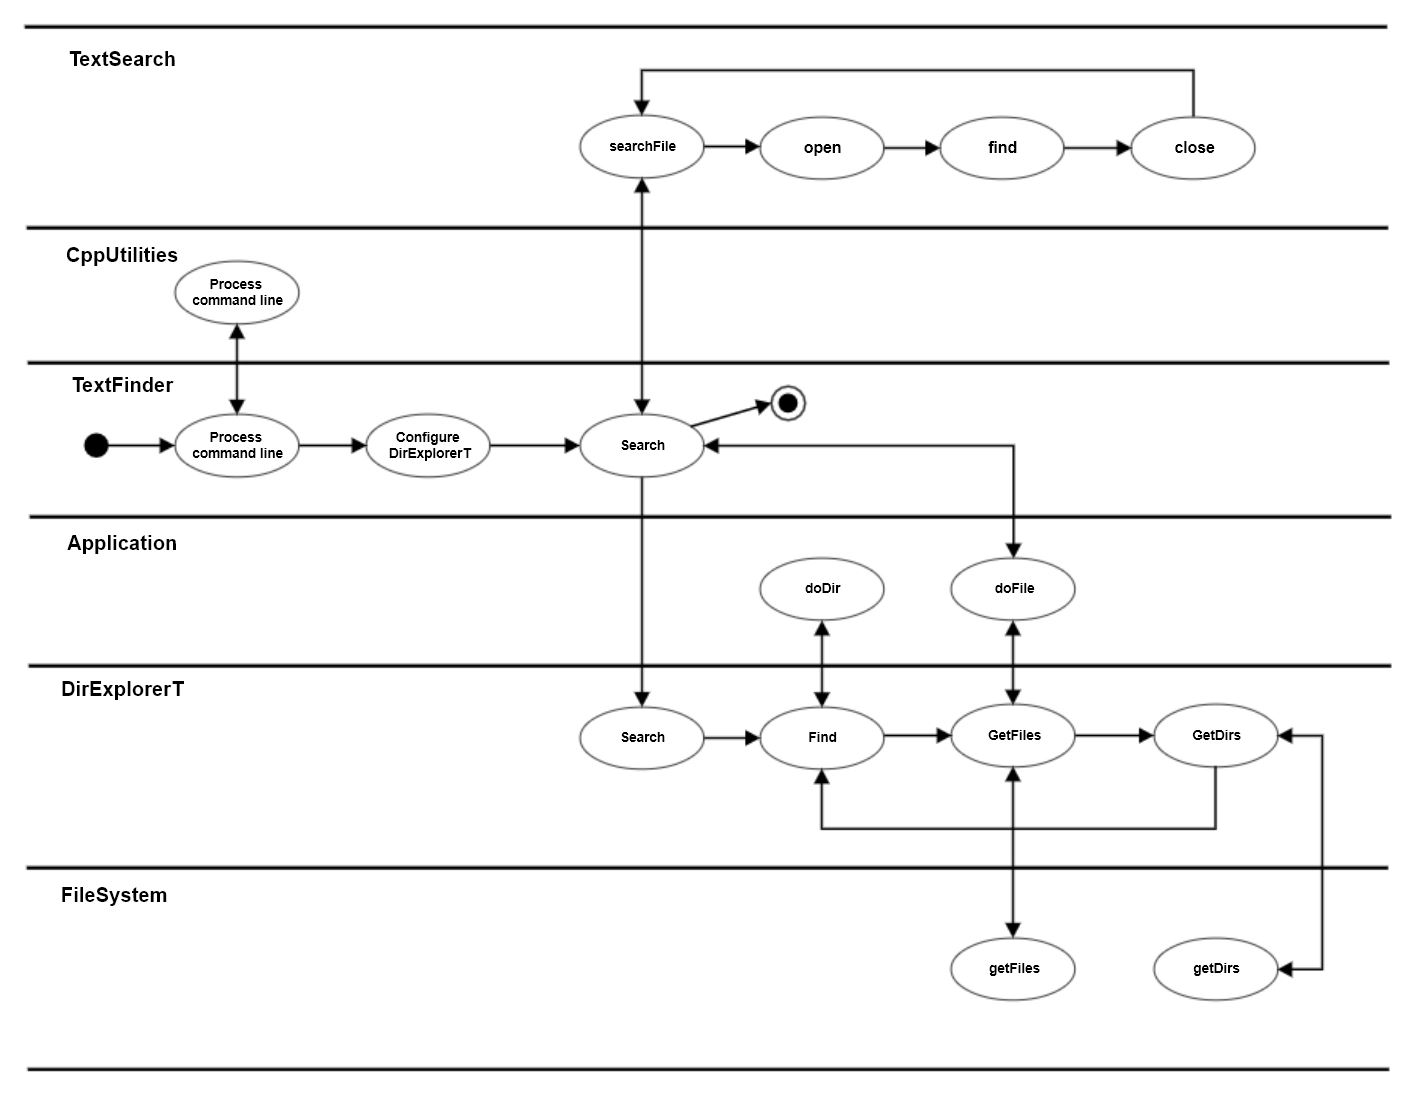
Figure 3. TextFinder Activity Diagram
Show a design's processing flows.
Activity Diagrams with Synchronization:
There is one more feature that may be used in activity diagrams, not shown in Figure 3., synchronization bars. In Figure 4. we show processing activity for a message-passing communication channel. That diagram uses several synchronizing bars to indicate places where processing may wait and where it may fork processing into concurrent activities. A synchronization bar is a filled narrow rectangle that may be either horizontal or vertical, based on the needs of the diagram. Each synchronizer represents a place where processing must wait, as for a deQueue operation or in a form waiting for user input, or where processing may fork by creating a child thread or process. The message-passing diagram illustrates activities that occur in a communication channel, where sender's messages are enQueued and later deQueued for processing. Also, they are used to represent the channel connection activity. There are specific semantics for multiple inputs to a synchronizer and multiple outputs from a synchronizer:
  • Mulitple inputs to a synchronizer indicate that no processing on the output side can occur until all of the input processing activities have completed.
  • Multiple outputs from a synchronizer indicate that each output is independent of the others and are forked for concurrent processing.
This is an extraordinarily useful representation, helping us to understand timing relationships between a program's processing parts. Note that the processing "bubbles" often correspond to processing in a single function. However, there is no mandate for that. We collect activities into a single process in any way that helps a reader to understand the design.
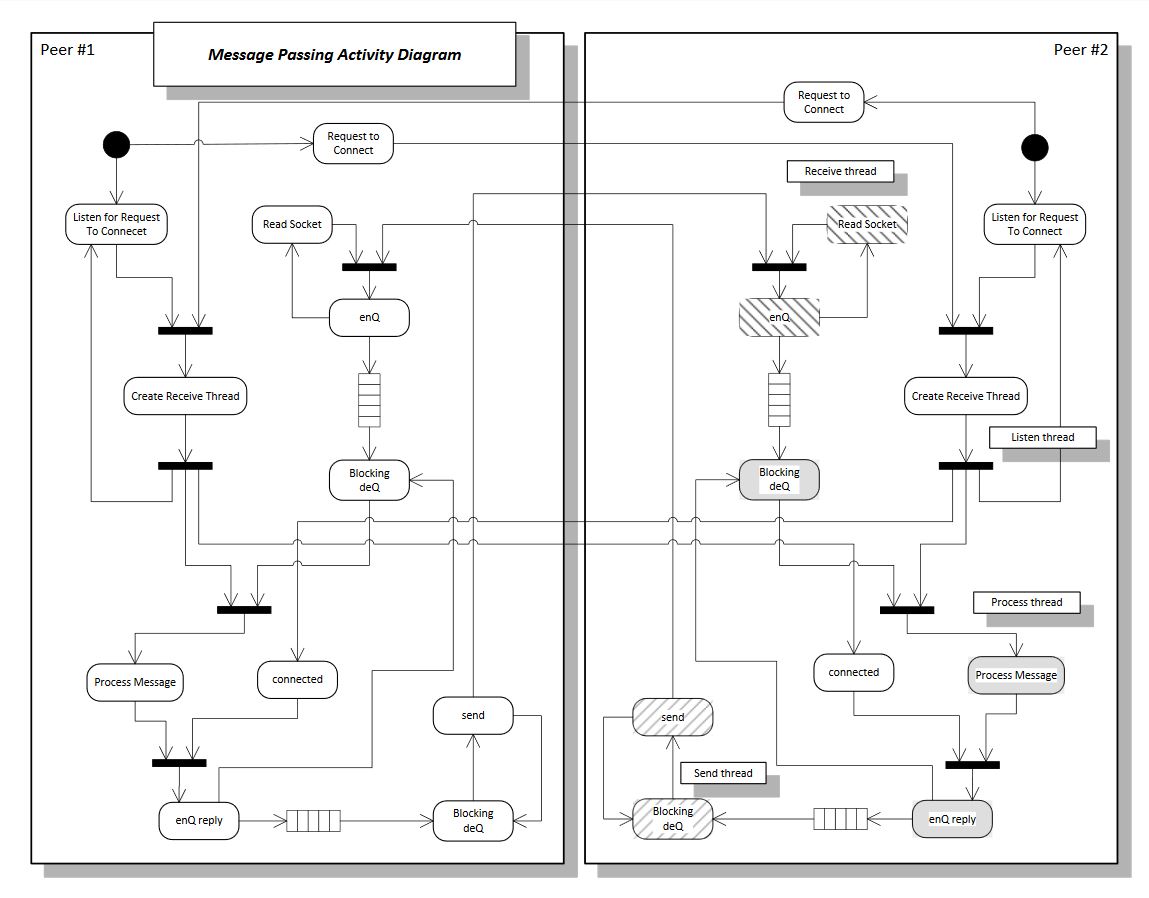
Figure 4. MsgPass Activity with Synchronization
Show a design's processing flows and synchronization.
Sequence Diagrams: Coming soon
Show dialog of message conversations between objects in a design.
State Diagrams: Coming soon
Show directed graph of states: states are vertices and transitions are edges.
Call Stack Diagrams (not UML):
Call graphs show calling relationships, usually for programs, or large subsystems. when calls are deeply nested, call graphs make flow of computation and control visible in a way that other diagrams do not. Figure 7 shows the call flow for the StoryTeller application. It makes its operation quite clear. StoryTeller uses an iframe to show a sequence of pages and other resources that make up a story, providing controls like [Next] and [Prev] to sequence through the content. Almost all of the actions eventually route to render, which controls the iframe by supplying it urls to load. When StoryTeller starts, it loads a StoryList page. User selections load a StoryTOC page that has a link and text for each page in the story. When StoryTOC loads, it analyzes its own structure and creates JSON strings for each page, e.g., url, name, and text, and writes that to localStorage. When StoryTOC loading completes, all its information is in localStorage, and an onload event is sent to the srcChange function. That loads the story into a pages array in StoryTeller and renders its first page.
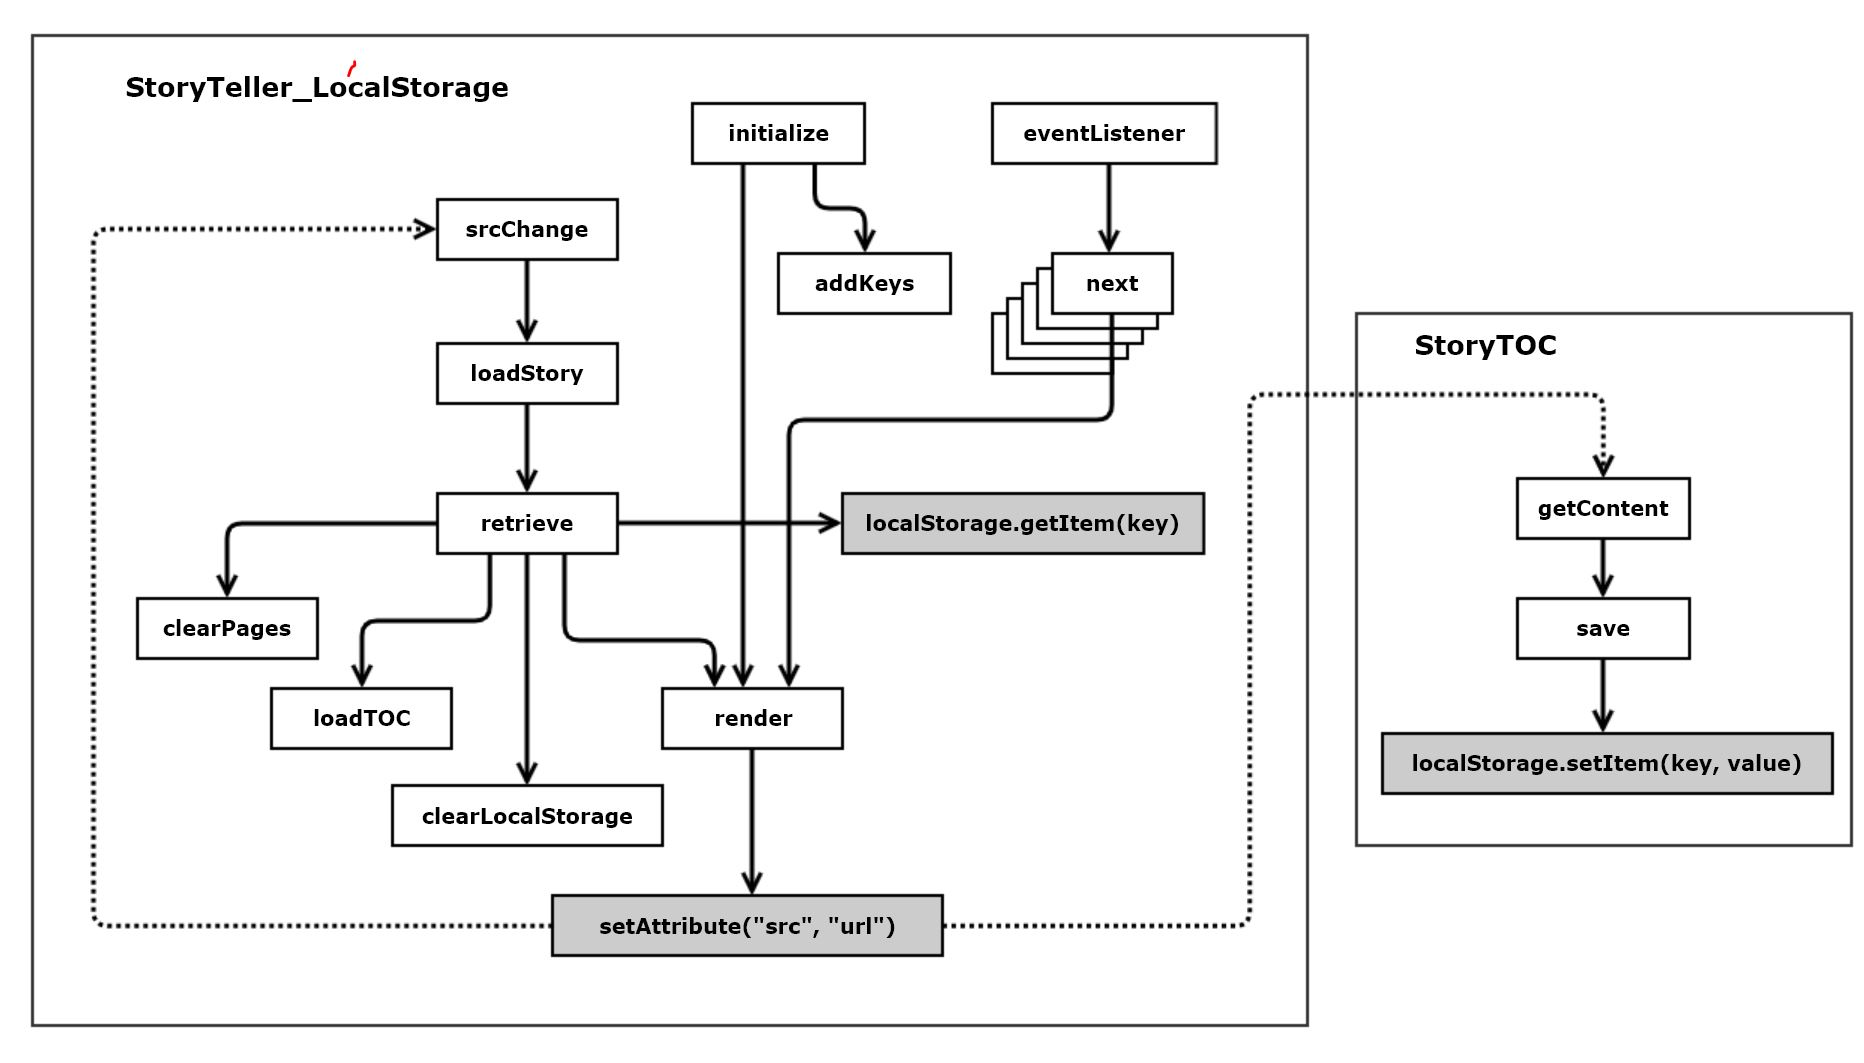
Figure 7. StoryTeller Call Graph
Show directed graph of function calls: functions are vertices and calls are edges.